

Ignore the Consensus

Earlier this year I posted a chart of muni bond flows and explained that, historically, investors have moved into and out of bond funds at the worst possible times.
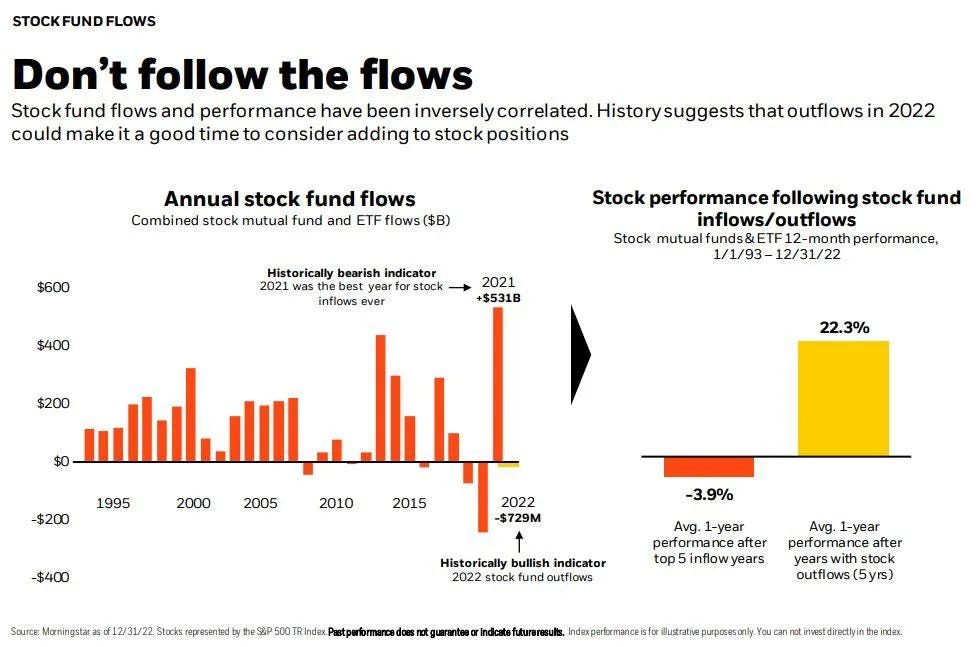
This week is simply a reminder that the same thing holds true for stocks. The worst stock returns tend to occur after investors get excited and pile in. The best stock returns tend to occur after investors get scared and abandon ship.
The chart on the left breaks down the fund flows by year. The chart on the right adds a metric of average S&P 500 performance following peak periods of inflows and outflows.
The numbers are astounding.
The average returns for the S&P 500 in the year following periods with the highest inflows (when investors have been the most optimistic) have been negative 3.9%. The return in the year following net outflows (when investors were the most pessimistic) averaged positive 22.3%.
This spread of more than 26% is why Warren Buffett famously reminds investors to “be fearful when others are greedy and greedy when others are fearful.”
When it comes to writing about investments, the disclaimers are important. Past performance is not indicative of future returns, my opinions are not necessarily those of TSA Wealth Management and this is not intended to be personalized legal, accounting, or tax advice etc.
For additional disclaimers associated with TSA Wealth Management please visit https://tsawm.com/disclosure or find TSA Wealth Management's Form CRS at https://adviserinfo.sec.gov/firm/summary/323123