


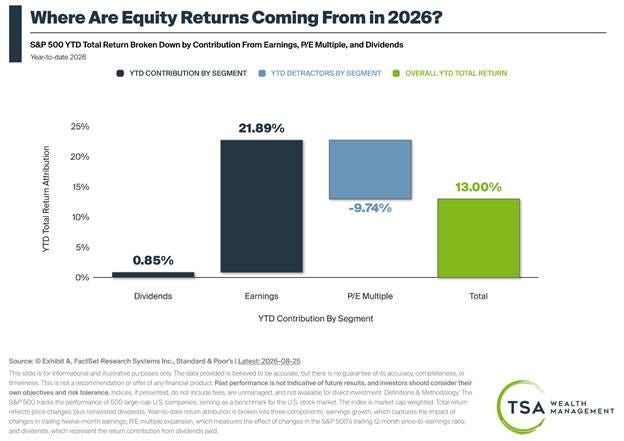
Sometimes it may feel like the stock market is going up because we’re in a bubble where everything is getting irrationally more expensive. But this chart tells a completely different story.
The green bar on the right shows the Year-To-Date total return of the S&P 500. The three blue bars to the left break that total return into its three components.
Dividends. The cash flow is distributed to the shareholders
Earnings. The profits the companies are generating.
Optimism About the Future (Price / Earnings Multiple). The amount investors are willing to pay for today’s earnings based on their expectations for the future.
Of the S&P 500’s year-to-date total return, .85% came from dividends, and 21.89% came from earnings.
The crazy part is that if investors were willing to pay as much for those earnings today as they were at the beginning of the year, the market would be 9.74% higher than it is right now.
In other words, the stock market has gone up, AND it has also gotten less expensive.
As random as share prices can feel day-to-day, long-term results are driven almost entirely by earnings. And today’s earnings have been really good.
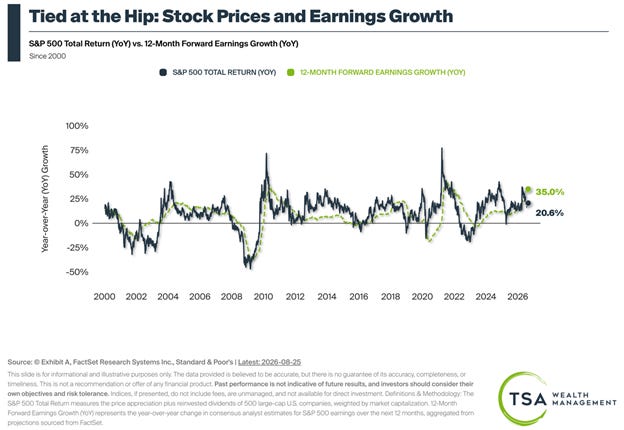
We can debate where the earnings are coming from and where they will go from here, but the fact that earnings, not investor enthusiasm, have been doing the heavy lifting is a good sign.
That doesn’t mean the ride will always be smooth, or that multiples can’t compress from here. But it’s a reminder that under the daily noise, the market still makes sense.
Personal Note:
This afternoon I'm heading to Washington, DC for my annual fantasy football draft with 11 friends from law school. This will be our league’s 19th season.

I can’t tell you a single player’s stats, and my selections are usually not the best, but I suspect it will be a good time.
When it comes to writing about investments, the disclaimers are important. Past performance is not indicative of future returns, my opinions are not necessarily those of TSA Wealth Management, an SEC-registered investment advisor, and this is not intended to be personalized legal, accounting, or tax advice etc.
For additional disclaimers associated with TSA Wealth Management please visit https://tsawm.com/disclosure or find TSA Wealth Management's Form CRS at https://adviserinfo.sec.gov/firm/summary/323123
Very interesting with regards to the market - Thanks
Enjoy your trip