The Math of Bond Returns
In last month’s presentation, I included two slides to make the case that five-year bond returns are a lot easier to predict than five-year stock returns. For this note, I’ll explain the two charts in a little more detail.
First up is the stock chart.
On the right side of the above chart, JP Morgan was looking at the forward price to earnings ratio of the S&P 500 to see if that could be used to predict the annualized return of the S&P 500 over the next five years. On the surface it looks like a powerful indicator (higher starting price to earnings ratios have historically meant lower five-year average returns) BUT only 27% of the total variation in total returns can be explained by the starting price to earnings ratio. That isn’t much.
[Note - The chart on the left side is looking at 1-year returns and makes the strong case that today’s price to earnings ratio tells you even less about what the stock market will do over the next 12 months.]
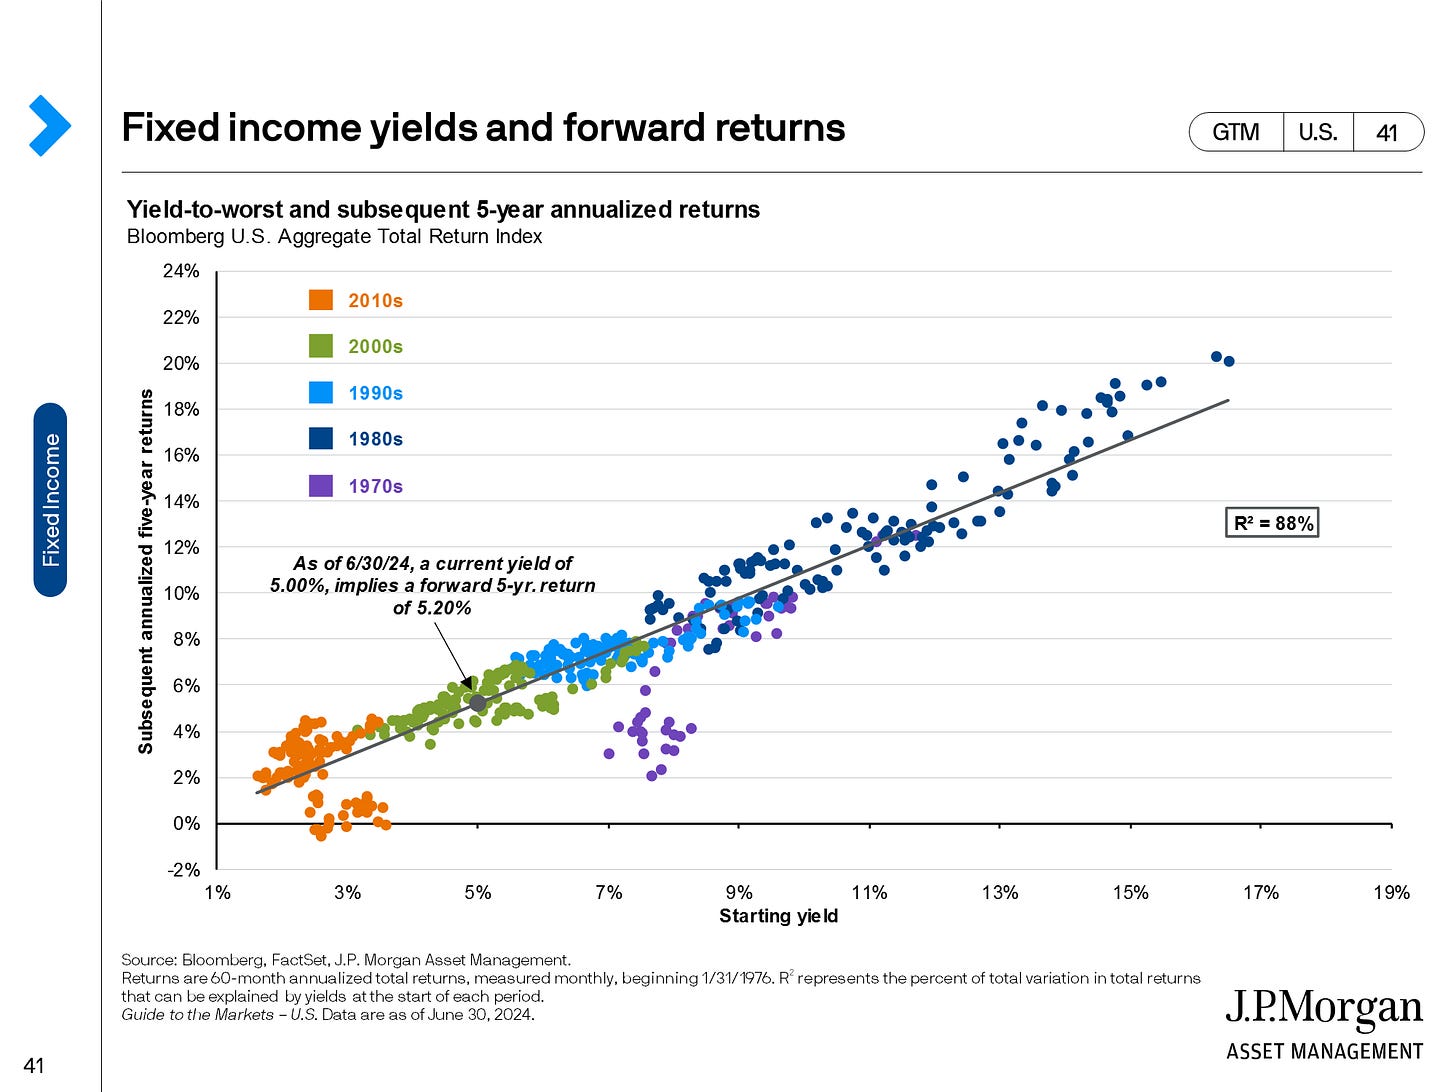
Bonds, however, are a different story. Below we have a similar chart looking at the five-year annualized return on the US Aggregate Total Return Bond Index.
88% of the index’s return over a five-year period is determined entirely by the index’s current yield at the start of the period. In other words, when interest rates are high, your returns for the next five years are more likely to be high. When interest rates are low, your returns over the next five years are more likely to be low. Today, relative to the previous two decades, interest rates are high.
So, if you are one of the many investors considering abandoning bonds because of their terrible performance in recent years, I would strongly advise against it. When it comes to a broad based portfolio of high quality bonds, past performance may not be indicative of future returns BUT starting yields generally are.
Bonus content:
If you made it this far and were looking for something more interesting than R squared analysis, here is picture from our most recent gar fishing trip on the Trinity River.


When it comes to writing about investments, the disclaimers are important. Past performance is not indicative of future returns, my opinions are not necessarily those of TSA Wealth Management and this is not intended to be personalized legal, accounting, or tax advice etc.
For additional disclaimers associated with TSA Wealth Management please visit https://tsawm.com/disclosure or find TSA Wealth Management's Form CRS at https://adviserinfo.sec.gov/firm/summary/323123