Why Average Returns Don’t Matter For Private Investments
Much has been written about a recent executive order that allows alternative assets, such as private equity, private credit, and real estate, to be included in 401(k) plans.
It’s being framed as a breakthrough for everyday investors who will now be able to invest their retirement savings in the same stuff as pensions, endowments, and the ultra-wealthy.
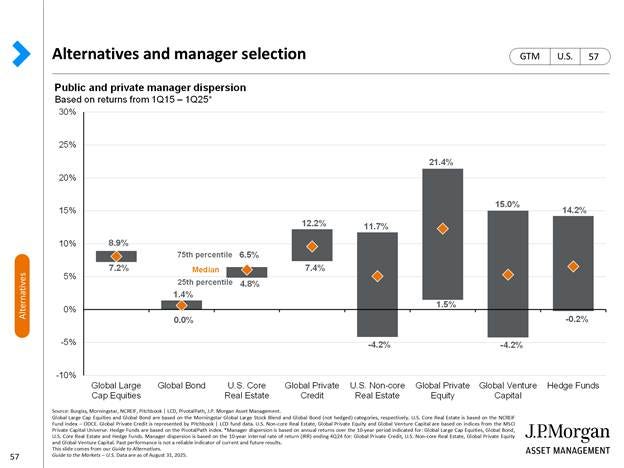
But before you get too excited about the opportunity, consider the chart below1.

Cool Chart . . . But What Am I Looking At?
The top of the gray bar represents the return generated by a fund ranked in the top 25% for performance over the last ten years. The bottom of the gray bar represents the return generated by a fund ranked at the bottom 25%. The orange diamond represents the median fund return in the category.
The categories on the left-hand side of the chart—Global Large Cap Equities, Global Bonds, and U.S. Core Real Estate—represent the funds operating in publicly traded markets.
The categories on the right side of the chart represent “alternative” asset classes.
Why Does This Matter?
When you buy a traditional fund that owns a portfolio of public securities, the manager you select doesn’t really matter. The market will determine 99% of the investment’s return. The manager’s skill/luck will drive the small remainder.
Regardless of which fund you pick, you won’t be much better or worse than the category average.
That’s not the case for non-public securities.
While the median private equity fund over the last decade may have generated returns of 12%, that tells you almost nothing about how you would have done.
If you picked an above-average fund, you may have made 20% / year. If you picked a below-average fund, you may have lost money after a decade-long hold.
Both outcomes are equally likely.
Take the Case of YieldStreet

If you aren’t familiar, YieldStreet is an online platform designed to widen access to alternative investments to Main Street investors. Only 10% of the opportunities they review make it through their due diligence process.
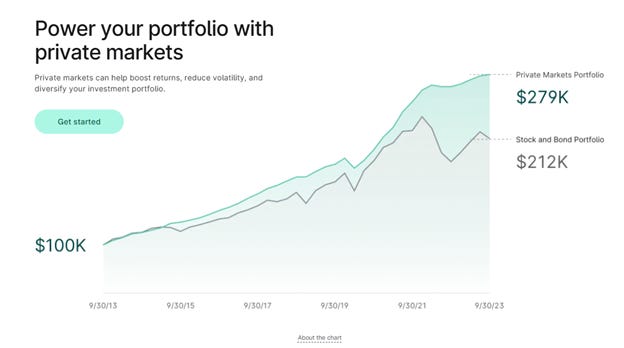
They put up charts like this one and say, “Private markets can help boost returns, reduce volatility, and diversify your investment portfolio.”

BUT . . . the Private Market Portfolio they present is a composite index comprised of 40% Private Equity (Cambridge PE Buyout Index) / 30% Private Credit (Cambridge Direct Lending Index) / 30% Private Real Estate (NCREIF Property Index).
In other words, if you get the average results of each index (which you cannot invest in), you will be better off.
But as this headline from CNBC points out, your investment experience may vary:
The short version is that investors didn’t realize how risky the real estate investments were; their money has been locked up for years, interest rates have increased, commercial real estate prices have decreased, and now many of the investments are being written off as total losses.
This was followed up a couple of weeks later by another CNBC article:
Yieldstreet tells investors in $89 million worth of marine loans to expect losses.
The short version here is that the company loaned out $89 million, collateralized by 13 ships, but the borrower never paid, and they lost track of the ships.
Maybe all of their other deals were home runs, and perhaps the average YieldStreet investor has done very well. I have no idea. However, I do know that the investors quoted in both articles, who have lost almost everything, don’t care about that.
When it comes to your retirement, the average performance is completely irrelevant. The only thing that matters is how well you do, and when you invest in alternatives, never forget that significant losses in an otherwise rising market are a very real possibility.
Personal note:
We are currently down to one foster dog. If you are in the market to adopt a puppy named Skeeter, he is still available.
For more thoughts on the topic, you can also check out my notes, The Mirage of Private Equity for Retail Investors & The Myth of Better Investing for the Ultra-Wealthy


Complex topic , analysis makes the puzzle workable , at least … thanks
Puppy news : ahhhh , tiny , adorable ( why the last … “ save the best for last “ that’s it “ )
When it comes to writing about investments, the disclaimers are important. Past performance is not indicative of future returns, my opinions are not necessarily those of TSA Wealth Management, an SEC-registered investment advisor, and this is not intended to be personalized legal, accounting, or tax advice etc.
For additional disclaimers associated with TSA Wealth Management please visit https://tsawm.com/disclosure or find TSA Wealth Management's Form CRS at https://adviserinfo.sec.gov/firm/summary/323123